Do you think that the latest AI-powered software is more capable than Excel when it comes to data mining?
Probably you may have missed out on the Excel in-build data mining features. Let us help you explore these Excel features so you can easily extract insights from your data.
Follow all the steps mentioned in this guide to get the best out of your data using only the Excelsheets.
Let’s get started!
How Excel is Useful as a Data Mining Tool
Excel is a popular and powerful software used widely across the globe, especially in organizations. It performs a wide range of functions for data assessment, data storage, and of course, data mining. Using various in-build tools, businesses are performing various things like regression analysis, clustering, anomaly detection, sequence analysis, and many more.

Some great things about Excel;
- Free to Use.
- Widely popular so no format issues.
- Supports external data sources.
- Data visualization is possible.
Most importantly, Excel has some in-build features, which are amazingly powerful for data mining and assessment. Nowadays, many AI-enabled software are available in the market offering mining services but all of them come with a hectic subscription plan.
Fortunately, with Excel, you can do many things with your data without any payment. As we have said Excel is free. Excel, in most business organizations, is not surviving; rather it’s thriving.
Here’s what the owner of ExcelCampus.com, an Excel Training and Development company, thinks about Excel; (of course, we reconstructed the statement)
Back to data-driven organizations, Excel is the ultimate tool to prepare data for further analysis. Plus, Excel files are easier to share among the people. Let’s not talk further about the Excel features, let’s start with the data mining process in Excel. For that, you need to follow a few steps as precautions to prepare the data.
Precautions Before Using Excel in-built Tools for Data Mining
Clean Your Data
Mining is a bigger game, and it starts with data cleansing. Before you begin the game, make sure your data is handy and clean. Data cleansing, as a step, can arrange your datasets in order.
It’s a simple process that starts with importing data into Excel. Enter it manually or export your datasets into Excel and then start rearranging. Few things to remember here.
- Delete duplicate data (Find “Duplication” option on “Data Tab”)
- Clearly label headers
- Fill absent entities (with relevant & concise data) [use the “Find & Replace” option]
That’s all the basics of data cleansing on Excel. If you need professional-level data cleansing for your large database, you can connect here.
Use Conditional Formatting
Let’s get insights from your data using conditional formatting. Use the “conditional formatting” option in Excel to set your data with a predefined benchmark. It makes your analysis simple as it would help you recognize trends, outliners, and patterns.
How to apply it?
- Select the data range that you need to check
- Go to “Home Tab” and tap on “Conditional Formatting”
- Excel will show you different options (with colors) to distinguish different values.
Well, you can customize the color option. For example, you can choose color cells as ups or down in ascending or descending order. Interestingly, conditional formatting is very easy to apply to data even if the size of the data is small.

Creation of Pivot Tables
Summarizing key data from the vast pool of databases is the main purpose of PivoTable. Form PivotTables once you filtered and sorted all your information. Creating these tables helps you aggregate and summarize the data.
Steps to Form PivotTables
A blank PivotTable interface will appear where you can drag and drop different data fields to create distinctive zones. In essence, you can summarize a diverse amount of data as you can analyze numerical data in different compartments.

Use Charts to Visualise the Data
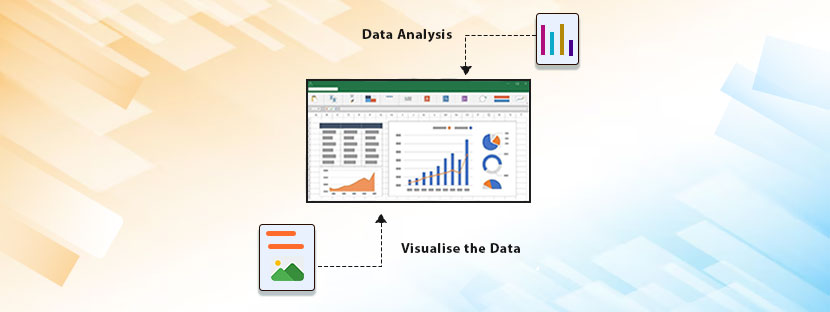
One of the best things about Excel in-build tools for data mining is the data visualization option. Get intuitive insights from data using Excel charts and make it simple to visualize the data. Create different types as Excel offers a wide range of options.
- Use LINE to display trends over time
- Use PIE to show information as a percentage of a whole
- Use SCATTER plot to compare two variables
- Apply BAR to compare different categories
Amazingly, Excel offers customization options where you can add new labels to your charts, insert titles, adjust colors, and many other things. Charts make data mining outcomes actionable and make data visible in easy terms.
Application of Excel in-build Tools for Data Mining
Apply the following common data mining techniques in Excel to process your data.
Regression Analysis
Identify the relationship between two or more variables using regression analysis. It’s an in-built data analysis tool available in Excel. Through this analysis, predicting the values of one variable is possible based on other variables. To perform a regression analysis in Excel, follow this;
- Select the ‘data range’ first.
- Find the “Data” tab → “Data Analysis” → “Regression” → “OK”.
Now, the ‘Regression’ dialogue box will appear. Put your input and output variables plus select the regression type. Also, select the output range where you want your data to be displayed. Once done click “OK” to perform the analysis.
Association Analysis
Identify interesting relationships between different sets of data using association analysis. This technique is often seen in market basket analysis where companies use it to understand buying patterns, campaign tracking, and many such things. Fortunately, this data mining feature is available in Excel.
To perform this analysis, you need some prior knowledge about statistics and data mining practices. Otherwise, the data, formulas, and the process can make you confused. To fix the knowledge gap, you can rely on some third-party tools like XLSTAT, XLminer, etc to perform association analysis. These tools help you generate association rules and explore data patterns.
Data Clustering
Identify patterns within a dataset using clustering techniques. Using Excel in-built tools for data mining along with a third-party tool like XLSTAT, you can do data clustering easily. Follow these steps to do so;
Classification
As a data mining process, classification helps predict data values of different categorical variables. Tools like XLMiner can help you here doing the classification analysis. For your information, classification techniques are the sum of various processes, which include logistic regression, neural networks, decision trees, and other metrics.
Search “Analytic Solver” as it is the current name of XLMiner.
To start the process, import your data into Excel and choose the technique where you want to initiate the classification. The tool will help you specify targets to train testing sets. Plus, you can customize your analysis settings in XLMiner. Further, you can explore data visualization options to present your findings.
Expert Opinion
Penetration of AI (Artificial Intelligence) is widespread across the industries. Every sector of the economy is adopting any form of AI-enabled software to track and analyze data. But the need for Excel has not diminished at all. The use of Excel is superbly common in every industry, medium to large. The financial industry is still relying hugely on Excel to perform all data works. This is the power of Excel and it’s super relevance. But what makes it so special and relevant? The answer is Excel in-built data mining tools.
Using these tools, any type of data analysis is possible in Excel. However, the real challenge is managing the huge volume of data in Excel without any mistakes. Plus, without data skills, preparing and managing data in Excel seems a little more complex. Well, AskDataEntry can help you here. We are a professional data entry outsourcing company and we know all kinds of Excel work.
Let us help you solve your complex data issues in Excel.
To get the solutions, contact us today!


