In This Article
- Why is it important to understand the difference?
- What is a questionnaire?
- What is a survey?
- Survey vs questionnaire examples
- Type of data you collect using surveys
- Research methods used in surveys and questionnaires
- How to write a questionnaire
- Run a successful survey, following these steps
- How to design surveys and questionnaires that pay you off
Want to gain valuable insights into markets, customer perceptions, and general feelings towards any products or events?
Surveys and questionnaires are for you. Look no further.
Both terms “survey” and “questionnaire” appear interchangeably (wrongly). It happens because people frequently view them as meaning the same thing. Hence, it needs rectification, especially when you’re conducting any form of research.
It’s overwhelmingly important for you to understand the basic and advanced-level differences between surveys and questionnaires. That’s why we’ve come up with this handy guide. This blog will help you define surveys and questionnaires in simple terms.
Why is it important to understand the difference?
Even if you’re conducting research for commercial purposes (for your business or others), you’ll be interacting with the public. So, you must have an idea of what to ask and how to ask them. You, a market researcher, must have an understanding of the meaning behind every phrase you’re using.
Whether to put a survey or a questionnaire, you should know the difference between them to collect your data from participants purposefully. For each phrase you use for the purpose of collecting data, you must have a deep understanding of it.
Further, understanding the key terms used for market research is a part of your journey. You should have an understanding of each term and its usage.
What is a questionnaire?
A set of questions. Duh!
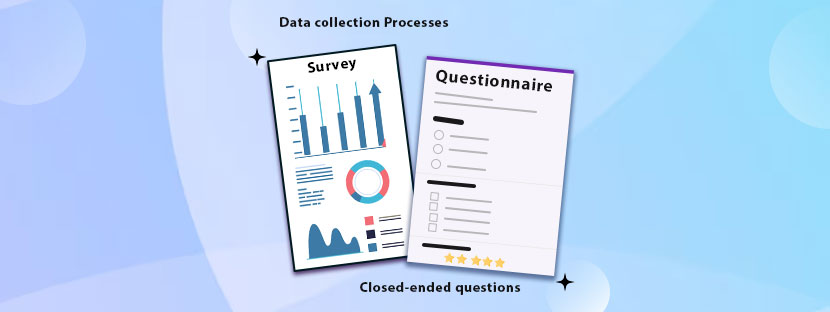
A questionnaire is simply a collection of questions that you give to your participants for market research. It’s a part of a wider survey process. Do not consider that getting the answer to your questionnaire completes the market research process.
Imagine you’re collecting responses on a sheet of paper by going person to person. The same concept applies to the questionnaire also, but through an online mode. Responses collected from one questionnaire will tell you information about one participant. When responses from questionnaires are integrated with a wider survey plan, it becomes immensely valuable.
Questionnaire examples
A questionnaire is essentially a set of questions. Let’s assume a picture…your office has just declared to start a mandatory work-from-home facility to promote work-life balance seriously. Well, it’s fictitious, but it does not harm to think of it. lol!
Now, your manager has given you the responsibility of determining the technology requirements your team needs to work conveniently from home.
Using a piece of paper and a pen, you frame out some questions and pass them to your team members. This paper that you passed is the questionnaire. Each member of your team will write their respective requirements into the paper. Hence, the questionnaire will discover individual answers, rather than a group.
What is a survey?
A survey is a broad version of market research. It’s a combination of questions, processes, and methodologies. If you want to understand a survey through the lens of a questionnaire, here it is
🡆 A survey should always have questionnaires involved
🡆 A questionnaire fills a small portion of a broad survey.
Surveys are basically a strategic method that provides crisp market insights. One thing you must understand is that surveys are costly to conduct. Therefore, you need to conduct it with full strength and accuracy.
Let’s understand the concept of survey in a more elaborate sense using the following examples.
Survey in research example

To discuss the survey thing, we’ll consider the questionnaire that we have discussed before. Using that questionnaire, you have collected individual answers from the respondents, right? Now, the survey will focus on your team’s experience.
A survey can be done to check the experience of your team during the work-from-home period. All your team members will receive the same type of questions and fill-in options. Many other types of questionnaires will be included under the same survey.
Basically, administering all your questionnaires is not a survey. A survey includes the collection of all your data, gathering all data in a useful way, and then combining them with other data. A survey covers a wider aspect than a brief topic, as a questionnaire does.
| Questionnaire | Survey | |
|---|---|---|
| Asking individual questions | ✅ | ✅ |
| Questionnaire delivery | ❌ | ✅ |
| Responses analysis | ❌ | ✅ |
Survey vs questionnaire examples
A questionnaire is…
Not a survey for sure. But it takes part in the survey process. A questionnaire is a set of questions where participants actually share their responses.
Think of a physical sheet of question paper to have a detailed idea about the questionnaire. A questionnaire is very likely to provide all the answers to your queries in detail. But it provides answers individually, not in a group. It means each answer would reflect a different point of view (most probably).
Complete research requires many sets of questionnaires that hold various sectors of information from various standpoints. Questionnaires combined with observation and insightful analysis of information turn into a survey. We will discuss this in the next point.
A survey is…
It’s a process of using questionnaires and other data collection processes to understand how a specific group is feeling.
Surveys are intended to collect data from various sets. The data you collect is then organized into quantifiable sets for further data analysis. It includes organizing quantitative data, such as numbers or statistics. Surveys also include redefining qualitative answers into quantitative data. For example, descriptive and emotional responses to facts and insights.
Organized data is the best for analysis, so a survey does that. Further interpretation of collected data leads to greater insights. It also reveals how a specific target audience may feel or behave if the data is processed well.
Type of data you collect using surveys
Researchers (marketing or educational) use surveys to gather qualitative as well as quantitative data. There are many varieties of surveys available for market search. Depending upon you intention, you use them for your research. For example, quantitative surveys use open-ended questions to gather detailed information. Or video response options are quite popular to collect detailed responses.
Here are the main types of data that you’ll collect from surveys;
Qualitative data
It’s the most typically gathered data type. It comes in a longer form with descriptive measures from your targeted survey audience. You can find the answers behind every “why” and “what” through this data type.
When the data becomes too complex or difficult to measure statistically, then qualitative data comes in. Qualitative data can usually you can gathered through open-ended questions. However, there are various other ways you can gather qualitative data. These sources are;
⟐ Moderated focus group
Do you know about focus groups?
Focus groups help researchers generate a guided discussion around the research topic. In this discussion, the moderator starts the discussion in such a way that it allows respondents to construct the conversation. The role of the moderator is important here. The moderator ensures the conversation stays on track. He makes sure the conversation stays relevant for the research.
⟐ Ethnographic research
Ethnography is the most rustic form of observation where all the participants are observed in a natural environment. The aim here is to gain insight into how users naturally interact in regular ways. This method includes direct observation, video recordings, diary studies, and a variety of other methods. Note that this method of research is a popular field-based research method used widely in social research.
⟐ Video Responses
Collecting video feedback has become popular over the years. It’s also another great way to collect qualitative data for the research. Mostly, companies and brands are using video responses as a medium to capture feedback at scale. One thing you must note here is that video responses show more authentic and natural insights. Researchers can also observe the participants through the video for further research purposes (mostly to find intention).
⟐ Moderated discussion
You can find a range of moderated discussions in focus group studies. Similar to focus group observation, researchers use online forums or any other platform to share the topic of discussion. Thereafter, the researcher collected dynamic data from the discussion. One thing is different here is that the researchers can flex their level of input during moderated discussion.
Quantitative data
Last in qualitative data, you have enquired “why” through the research. But in quantitative data, you need to inquire “what” through the research.
Basically, quantitative data is more statistical data, which is based on numerical data. This type of data helps you understand “hard” facts about the research topic.
Suppose you want to develop your content strategy. Therefore, using quantitative data helps you understand the latest trends, consumer behavior, and other forms of vital data insights that can make your content worthy and engaging.
Similar to qualitative data, quantitative data can also be collected via different methods and processes. Some of the most important methods are;
⟐ Ordinal
Assess the level of depth towards a data value using ordinal data. It follows a natural order to detail the datasets. The application where ordinal data can be found is a survey. It helps uncover agreement levels towards certain statements and assess preferences.
For example, a respondent can choose “strongly agree” instead of “agree” to show the level of desperation. Ordinal data strikes a balance between objective and subjective preferences and reveals data or responses in a uniform format. That’s why you can observe that ordinal data is being widely used in hypothesis testing or in advanced analysis tools.
⟐ Nominal
Some sorts of data cannot be measured in any meaningful way for data analysis. Nominal data represent those data types. You cannot place these data types in any order or perform any sorting work. For example, somebody is sharing his favorite food items like sandwiches, tahini, burgers, gialto, etc., you can categorize them into food items for the sake of quantitative data. And that’s it.
⟐ Discrete
Consider the amount of profit a company makes in a random month of a specific year to understand discrete data. This data type only represents particular values, not necessarily using whole numbers.
⟐ Continuous
Sometimes, continuous data is referred to as “infinite” data. It gets its name from a continuous range of datasets. For example, continuous data can include temperature, weight, or distance. Continuous data changes over time, and that’s the very nature of it. Continuous data uses a scale to measure, as the highest range is infinite.
Research methods used in surveys and questionnaires
As we have seen in the previous sections, questionnaires are a part of a broad survey process. Whereas surveys are quite a big part of the research process. There are plenty of research methods available to conduct surveys and questionnaires. Let’s have a look at them to understand each one of them.
◉ Qualitative Research
With an aim to collect data that is useful for decision-making, qualitative research is conducted. It includes in-depth questioning of respondents to bring detailed survey data. Each response can be unique from another. Differences of opinions and thoughts are welcome and recorded in this qualitative research method.
To collect qualitative research, researchers need to carry out interviews, focus group studies, one-to-one or moderated group discussions, and other methods.
◉ Quantitative Research
It’s all about gathering statistical insights from the data. Collecting statistical data (i.e., numbers) is the sole aim of quantitative research. It helps uncover the trends that help researchers make decisions. Plus, it also helps predict the future as it reveals the current trends.
Collecting data through customer satisfaction surveys or employee retention surveys is the prime example of quantitative research. It will showcase the main issues through a subjective lens of the researcher.
◉ Descriptive Research
Rather than focusing on “why”, descriptive research focuses more on finding answers to “who”, “where”, “what”, and “when”. Descriptive research helps researchers to find out unique characteristics of a population, situation, or phenomenon that they’re studying.
◉ Analytical Research
Understand why certain things happen and the order of their occurrence using analytical research. Conducting analytical research is excessively useful for making strategic decisions. Applying critical thinking is a part of the process under this research method, and that’s the reason the research demands analytical support.
◉ Exploratory Research
Researchers choose a topic of research that has not been previously covered. Exploratory research helps researchers use different ranges of quantitative and qualitative methods to explain and explore a topic.
◉ Applied Research
Finding practical solutions to get away with real-life problems is the main purpose of applied research. For example, organizations can conduct research to find our workplace issues, productivity measures, etc, to tactically handle the challenges.

How to write a questionnaire
SurveyMoney (a widely popular survey platform) conducts 3.5 million plus surveys each year. They stress designing the surveys, too, as a part of the process. Setting up a questionnaire is also a part of the same process.
Asking great questions matters the most if you want to conduct a survey that stands out. Therefore, you need to take the responsibility of adding relevant and conscious questions to your questionnaire.
That’s what it’s been said that whether your questionnaire stands on its own or is part of a survey, to acquire great responses or results, you have to ask great questions.
Keep the length of your questionnaire in mind while writing it. Many research organizations have realized that the survey response rate decreases when the number of questions in the questionnaire increases. More than 10 questions in a questionnaire can decrease the response rate up to 40%. Without any rewards, you cannot keep people for more than 5 minutes answering your questionnaire.
Questions can make the entire picture different. Asking relevant questions can make people stay on the platform. That’s why you need to frame and ask good questions as a part of your questionnaire strategy.
Run a successful survey, following these steps
Running a successful survey isn’t just about throwing a few questions together and hoping for the best. It’s about strategy, clarity, and purpose.
Whether you’re collecting customer feedback, employee opinions, or market insights, the way you design and manage your survey determines how valuable your results will be. Here’s how to do it right.
① Define Your Purpose Clearly
Before you write a single question, define what you want to learn. Are you trying to improve a product, measure customer satisfaction, or explore a new business idea? A clear goal keeps your survey focused and prevents unnecessary questions. Think of it like a GPS; without direction, your survey will wander aimlessly, and your data will lead nowhere.
② Know Your Audience
Understanding who you’re surveying is just as important as knowing what you want to ask. Tailor your tone, language, and questions to fit your audience’s profile. For example, questions for tech professionals will differ from those for students or older citizens. The more relatable your survey feels, the more genuine responses you’ll receive.
③ Keep It Short and Simple
No one likes a marathon survey. Keep it concise — 10 to 15 questions are usually enough. Use simple, direct language and avoid jargon or confusing phrasing. Make sure each question serves a purpose. If it doesn’t tie back to your goal, cut it out. The easier it is for respondents to complete, the higher your completion rate will be.
④ Craft Smart Questions
A successful survey mixes question types strategically. Use multiple-choice for quick insights, rating scales for satisfaction levels, and open-ended questions for qualitative feedback. Avoid leading or biased questions like “How amazing was your experience?” they skew results. Instead, stay neutral and let respondents share their honest opinions.
⑤ Test Before You Launch
Before sharing your survey widely, test it on a small sample of people. This helps identify confusing questions, technical issues, or errors. A pilot test also shows if your questions actually capture the data you need. It’s far easier to fix mistakes early than after responses start rolling in.
⑥ Choose the Right Distribution Channel
Your survey’s success depends on where and how you share it. Email, social media, website pop-ups, or direct messages all can work, but pick the one your audience uses most. For business clients, email might be best; for younger demographics, social media links could be more effective.
⑦ Offer Incentives (Optional but Effective)
A small incentive like a discount, free resource, or entry into a giveaway can significantly boost participation. People love to feel rewarded for their time, and even small gestures can make a big difference in response rates.
⑧ Analyze and Act on the Data
Collecting responses is only half the job; analyzing them is where the real value lies. Look for patterns, trends, and actionable insights. Share results transparently and use them to make informed decisions. Let participants know how their feedback is making an impact; it builds trust and encourages future participation.
How to design surveys and questionnaires that pay you off
Understanding the differences between a questionnaire and a survey is important when it comes to market research.
First, you should have meaningful questions to ask
Always think about your audience first and plan how you can efficiently communicate with them. Using simple language is the best way to get close to them. Do not use any jargon or acronyms, as these elements make your questions unnecessarily complex.
People will open your survey link on a small screen. So think about it also. How your survey will look on a small screen should be taken care of during this course. Further, you need to reduce the load on the responders’ working memory. Asking too many difficult questions or some questions that go against their beliefs can trigger them.
Getting survey bounce is not our aim. Thus, we have to be meaningful when asking questions. Avoid visual triggers; keep questions plain and simple.
Mix various question types
Getting reliable data from survey responses requires choosing the right type of survey. Choosing the right mix of question types can help. Asking too many open-ended questions can increase the survey drop-out rate. People do not like to think too much. They like to answer multiple-choice questions when it comes to responding to surveys.
Therefore, if you have a total of 9 questions in your questionnaire, you can ask 1 or 2 open-ended questions. Not more than that.
Keep everything short and brief
From clicking your survey link to clicking the submit button, your survey should take less than 10 minutes. If it takes a longer time, you’ll end up increasing bounce rates. Participant engagement generally drops if the survey consumes more time. Hence, keep your survey as short as possible.
If you require any help regarding survey design or processing, please feel free to reach us. We have relevant expertise and experience handling everything related to surveys.


